
Search for automotive aftermarket industry statistics, and you’ll notice something odd. Market reports offer vastly different estimates of the industry’s size, even when they appear to cover the same market. These differences can make it difficult to understand the industry’s actual size and growth potential. That makes it challenging to know which figures to trust or compare.
The differences often come down to what each report measures. In this guide, we’ll break down global and U.S. market estimates, explain why the numbers vary, and explore what’s driving aftermarket demand in 2026.
Automotive Aftermarket Industry Statistics at a Glance
The automotive aftermarket includes replacement parts, tires, fluids, accessories, maintenance, and repair services purchased after a vehicle’s original sale. Market estimates vary considerably depending on whether they include service labor, vehicle categories, and the wider supply chain.
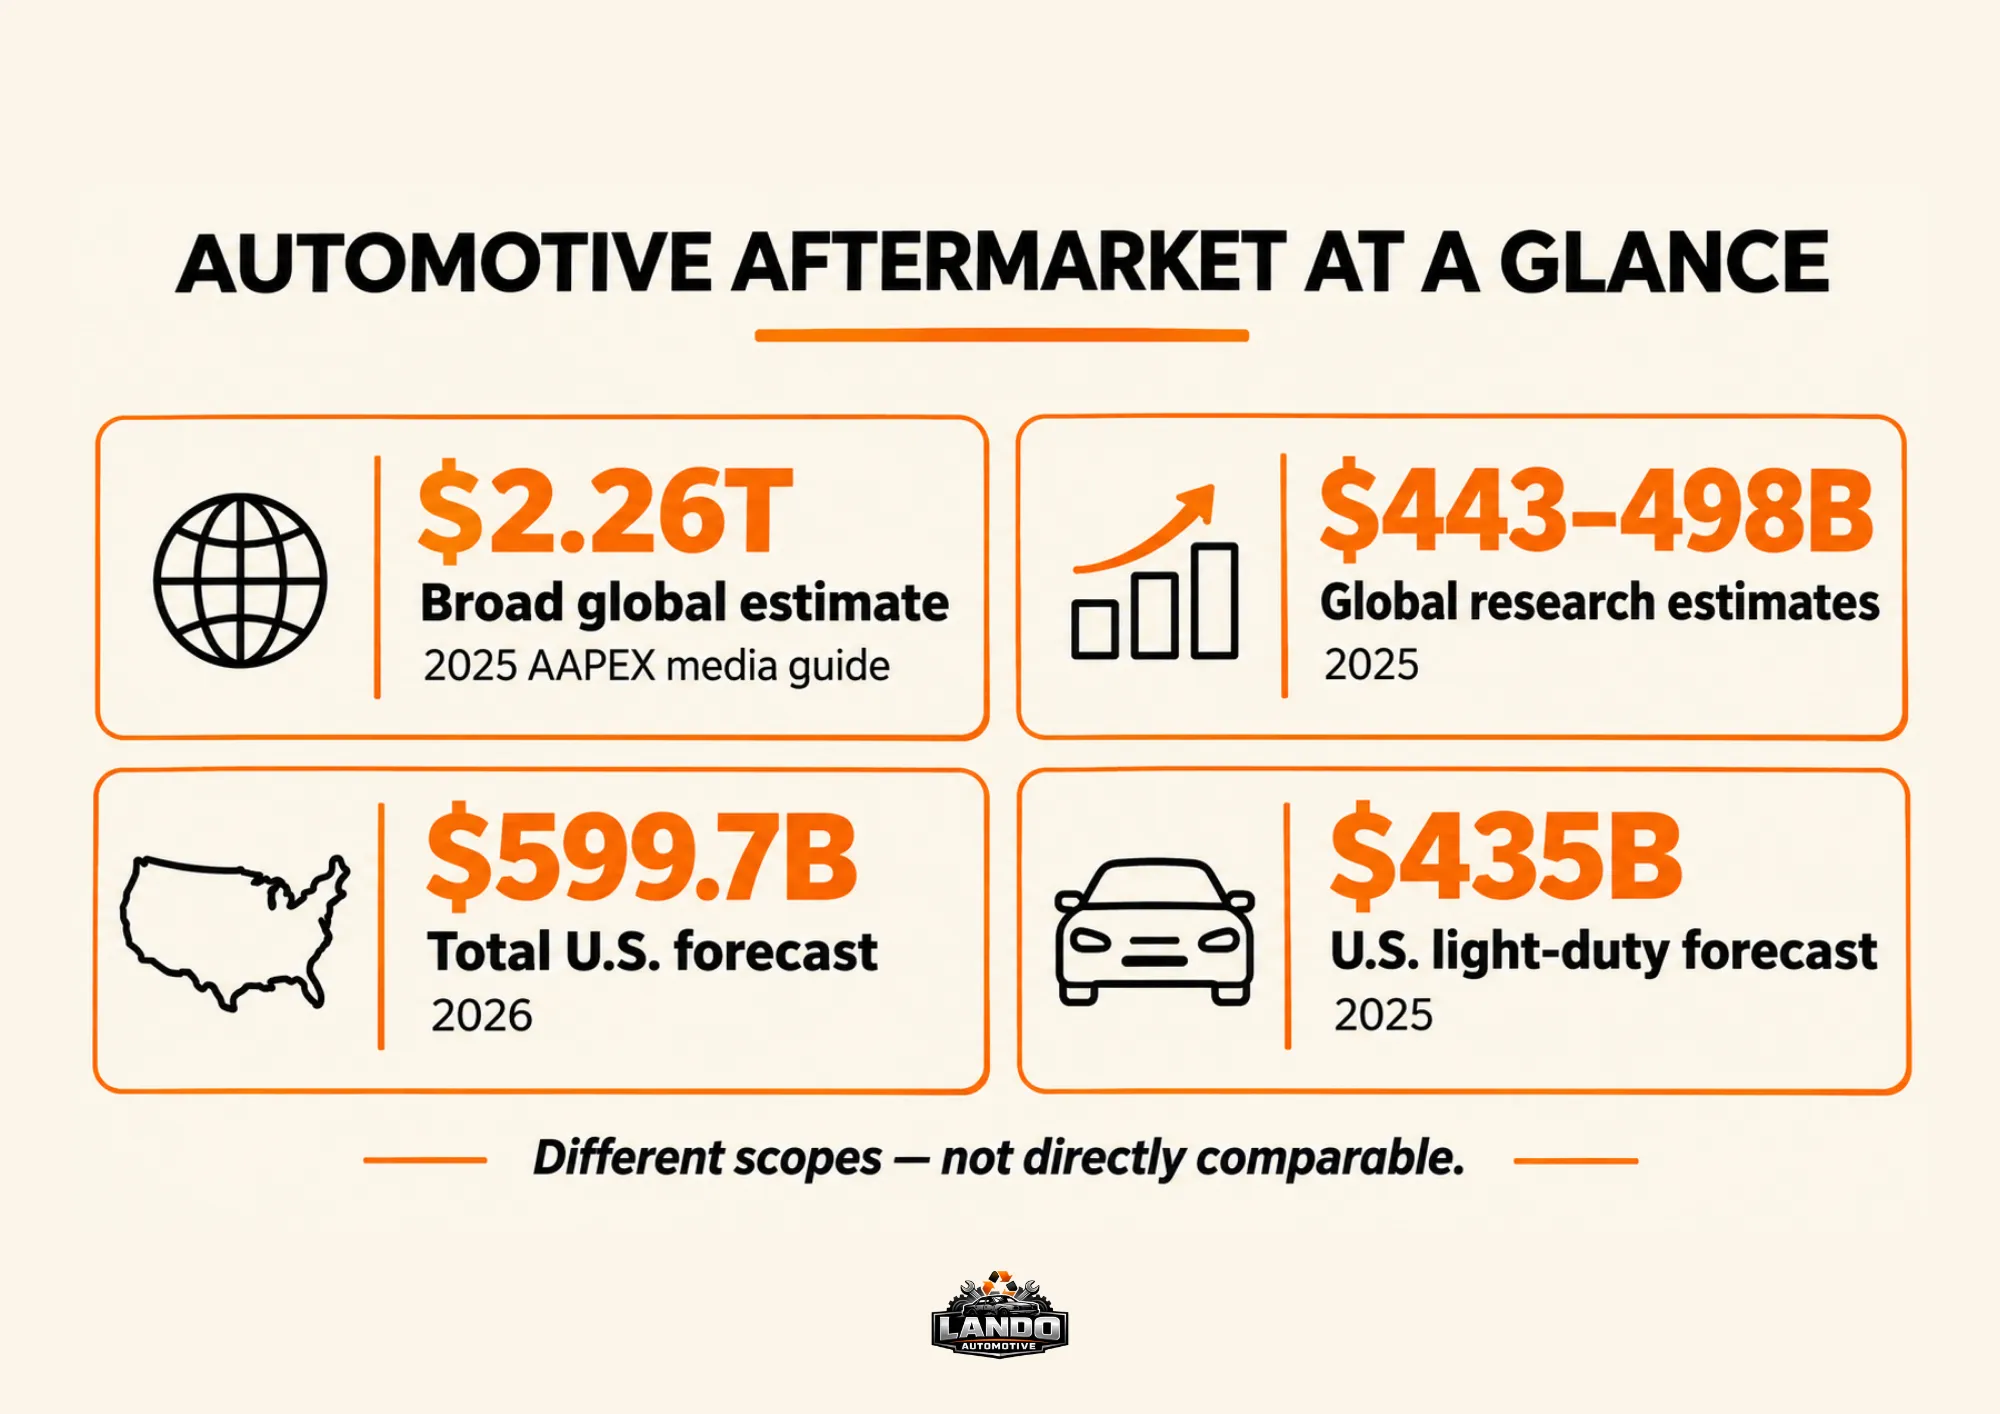
The 2025 AAPEX industry media guide estimates the global aftermarket at $2.26 trillion across 130 countries. Commercial research reports publish substantially lower figures, reflecting different market definitions.
| Estimate | Geography | Year | What It Measures |
| $2.26 trillion | Global, 130 countries | 2025 media guide | Broad automotive aftermarket |
| $443.12B–$489.5B | Global | 2025 | Commercial market estimates |
| $568.7B | U.S., all vehicle classes | 2025 implied | Total automotive aftermarket |
| $599.7B | U.S., all vehicle classes | 2026 forecast | Total aftermarket, up 5.4% |
| $676.5B | U.S., all vehicle classes | 2029 projection | Total automotive aftermarket |
| $435B | U.S., light-duty | 2025 forecast | Non-warranty parts, fluids, and service labor |
| 5.2% growth | U.S., light-duty | 2026 forecast | Non-warranty aftermarket |
| Over $500B | U.S., light-duty | 2029 projection | Same light-duty market |
These estimates should not be averaged or treated as interchangeable. The broad industry totals and commercial market estimates use different definitions.
What Does the Automotive Aftermarket Include?
The automotive aftermarket covers replacement parts, accessories, and services purchased after a vehicle’s original sale. It includes products used for routine maintenance, mechanical repairs, and vehicle customization, along with the labor required to install or repair them.
Replacement parts and accessories
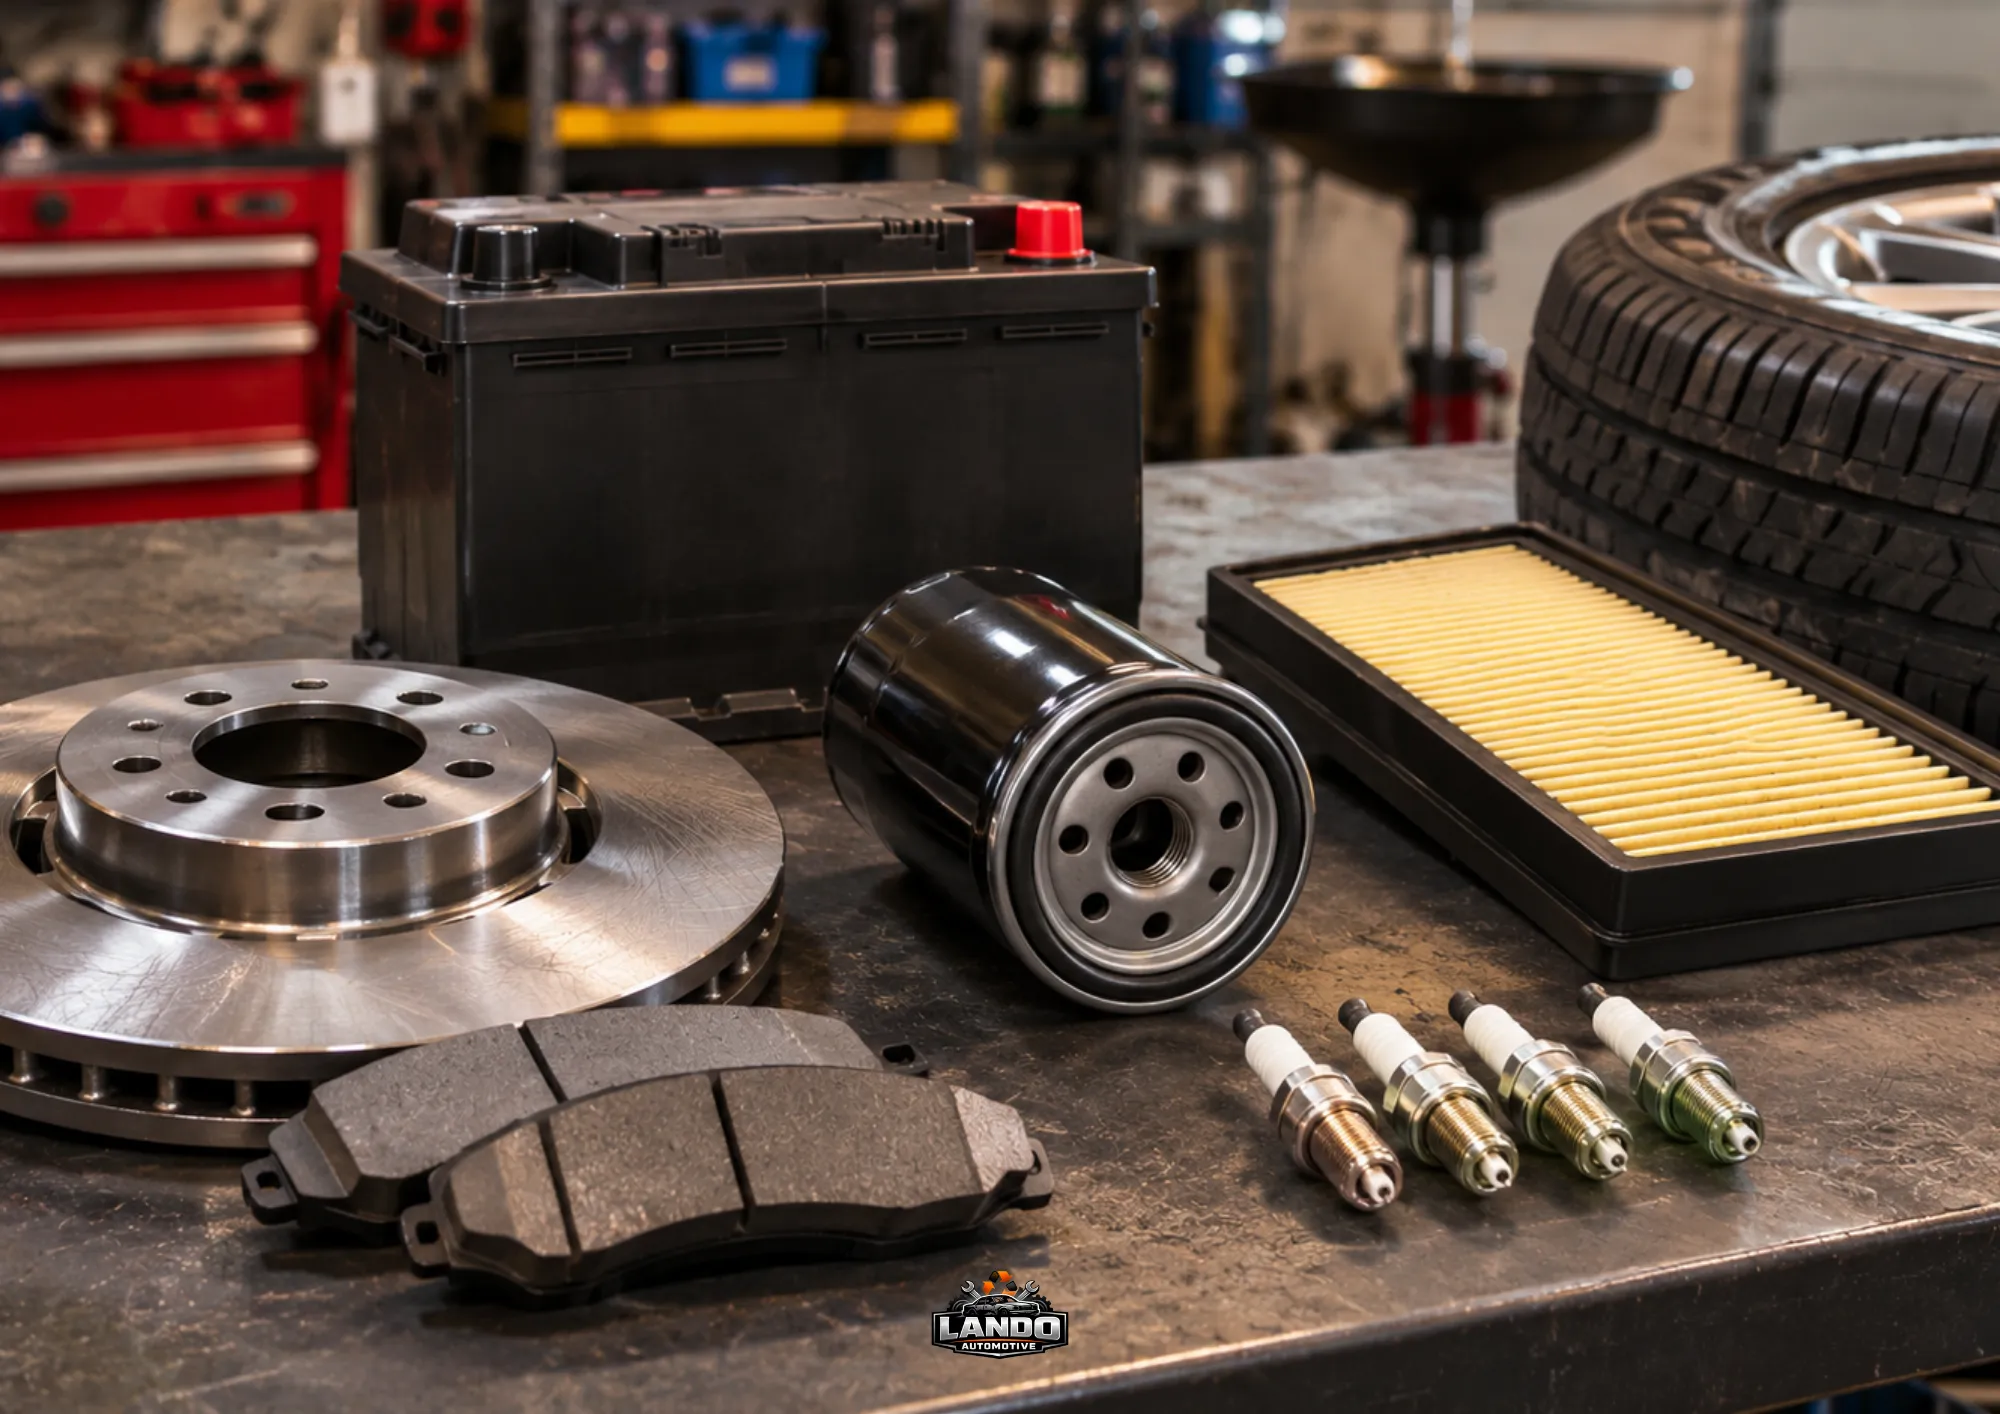
Replacement parts include brakes, filters, batteries, tires, lighting, body panels, and wheels. These products help maintain vehicle performance, replace worn components, or repair damage. They reach customers through dealerships, independent parts retailers, repair shops, and online sellers.
Accessories serve a different purpose, allowing owners to improve a vehicle’s appearance, performance, or functionality. Examples include upgraded suspension systems, custom wheels, and exterior modifications. The specialty equipment segment generated approximately $52.92 billion in U.S. sales, according to the 2026 SEMA Market Report. This represents a specific part of the aftermarket, not the entire industry.
Repair and maintenance services
Repair and maintenance services include routine oil changes, brake servicing, tire installation, diagnostics, and mechanical repairs. These services generate revenue from both replacement parts and the labor needed to complete the work.
Service labor is included in broader aftermarket estimates, which helps explain why total industry values exceed parts-only sales. For example, the 2026 U.S. light-duty aftermarket forecast includes non-warranty parts, fluids, and service labor.
Vehicle age, mileage, and maintenance needs influence demand for these services. As components wear out, owners may need more frequent repairs, creating recurring business for independent repair shops, dealerships, and service chains.
How Large Is the Global Automotive Aftermarket?
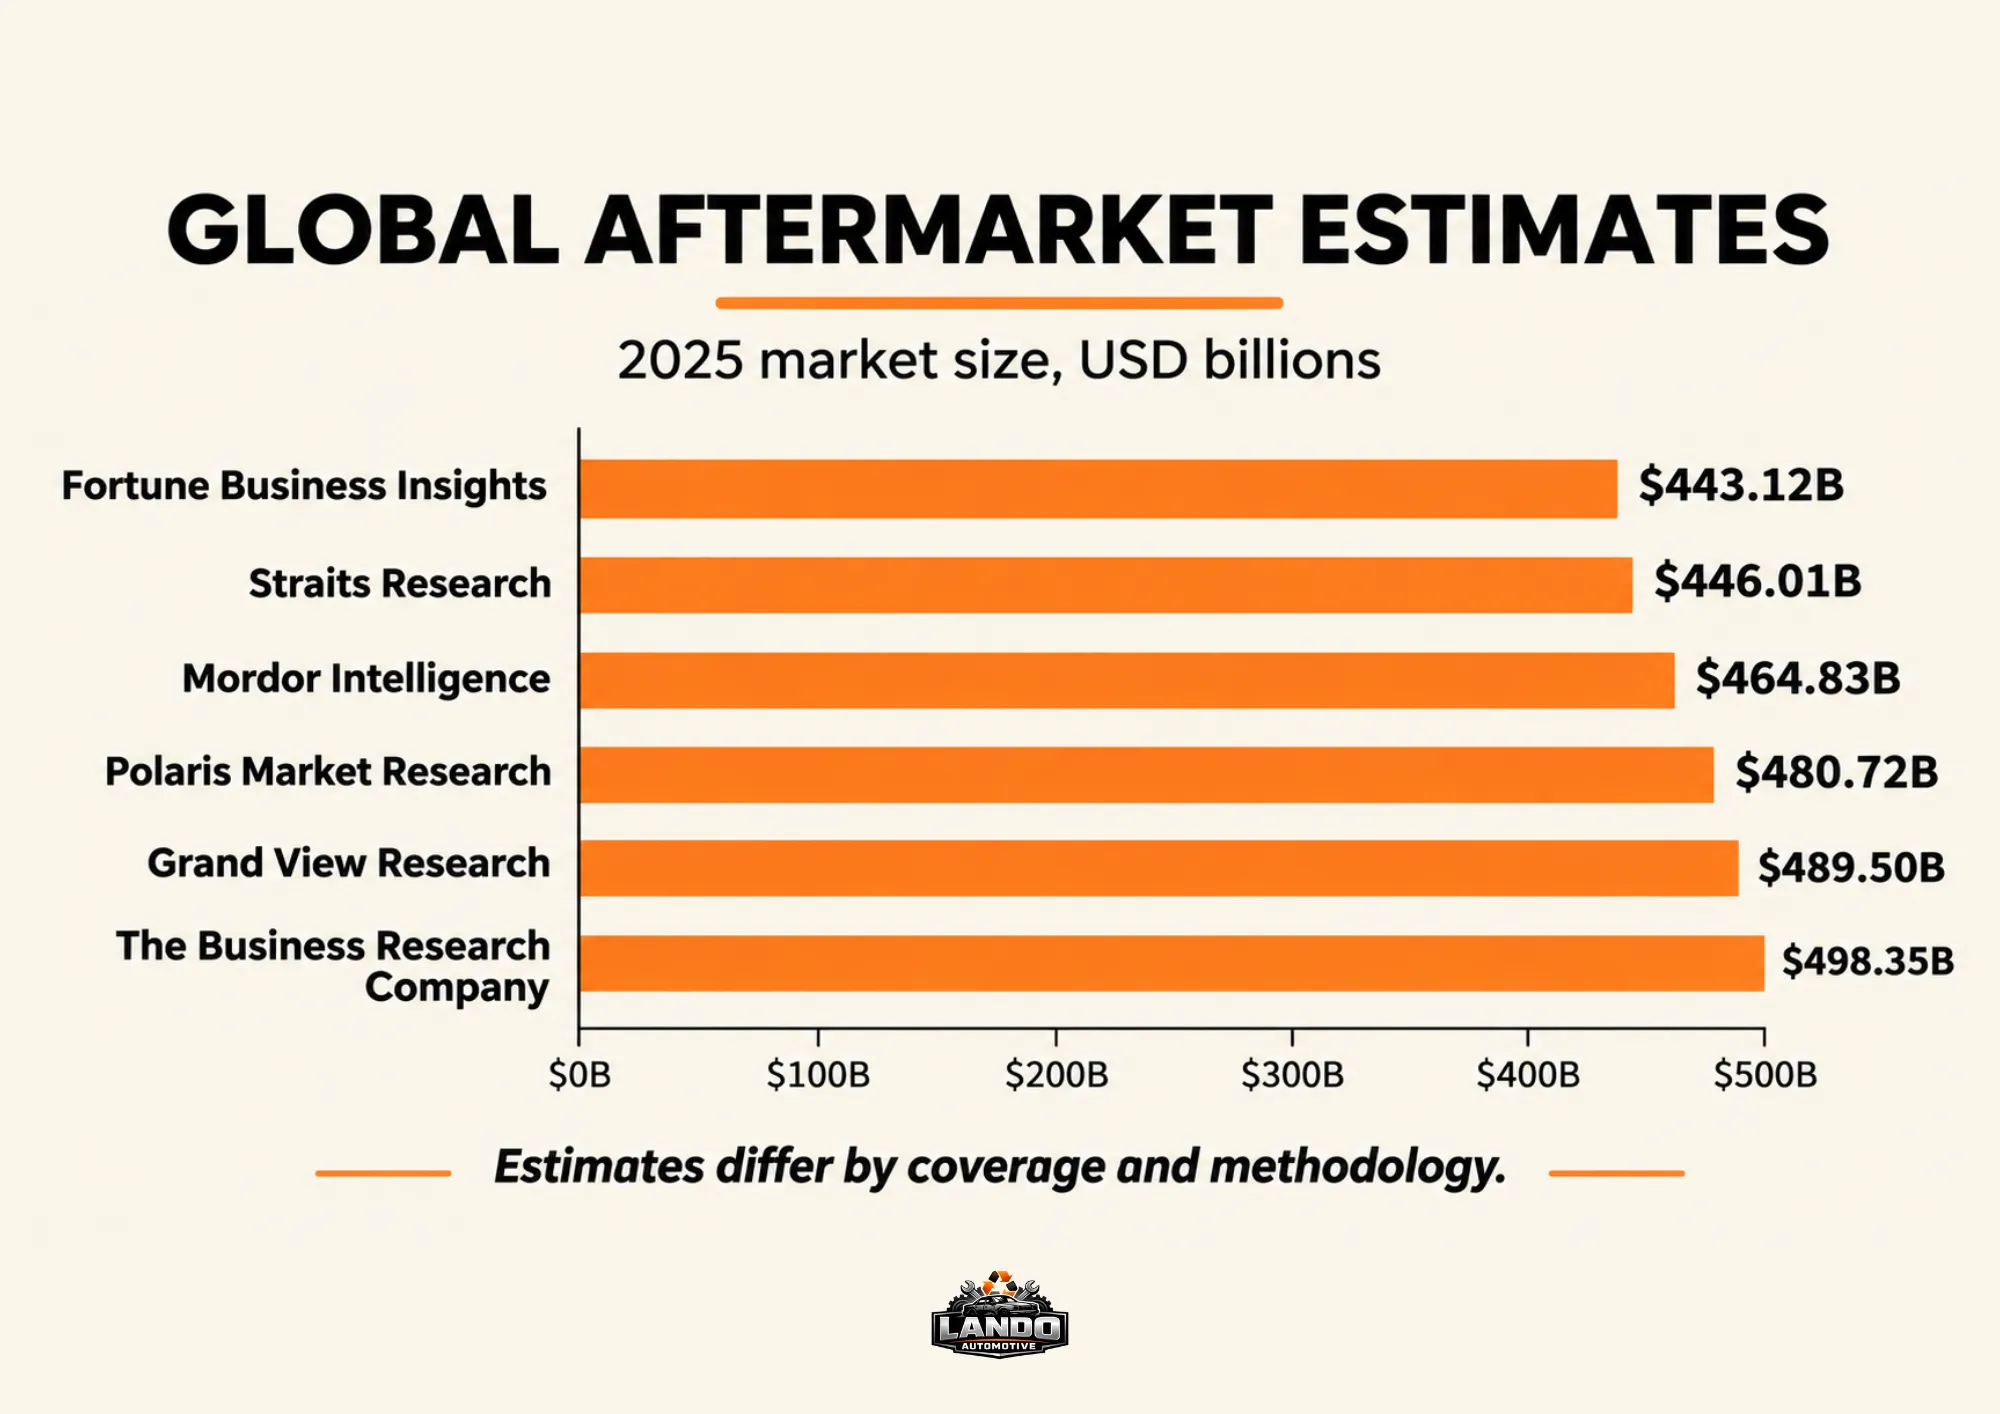
Automotive aftermarket industry statistics from six commercial research reports place the global market between $443 billion and $498 billion in 2025. All six project continued growth, although their forecasts differ in size and timing.
| Source | 2025 Market Size | Forecast |
| Fortune Business Insights | $443.12B | $604.57B by 2034; 3.56% CAGR |
| Straits Research | $446.01B | $613.17B by 2034; 3.6% CAGR |
| Mordor Intelligence | $464.83B | $555.82B by 2030; 3.64% CAGR |
| Polaris Market Research | $480.72B | $676.78B by 2034; 3.9% CAGR |
| Grand View Research | $489.50B | $643.8B by 2033; 3.4% CAGR |
| The Business Research Company | $498.35B | $722.43B by 2030; 7.8% CAGR |
CAGR refers to compound annual growth rate. Forecast periods differ by publisher, so the growth rates aren’t directly comparable.
Why estimates differ
The gap between estimates reflects differences in market coverage and research methods. Reports divide the industry by vehicle type, replacement parts, sales channels, and services. Some include two-wheelers, while others focus on passenger and commercial vehicles. These distinctions affect the reported totals.
Beyond market size, demand is supported by aging vehicles, recurring maintenance, and replacement parts. Online parts sales and vehicle diagnostics are also changing how aftermarket products and services reach customers. However, electrification is shifting demand away from some traditional engine components toward batteries, electronics, and other specialized parts.
For market comparisons, use each estimate with its stated scope and forecast period rather than treating the figures as one consistent dataset. The published reports provide estimates, not a single independently established global market value.
U.S. Automotive Aftermarket Statistics
The U.S. automotive aftermarket includes replacement parts, maintenance, and repair services for vehicles already in use. Market figures differ depending on whether they cover all vehicle classes, light-duty vehicles, or retail parts sales alone.
Total U.S. aftermarket sales and growth
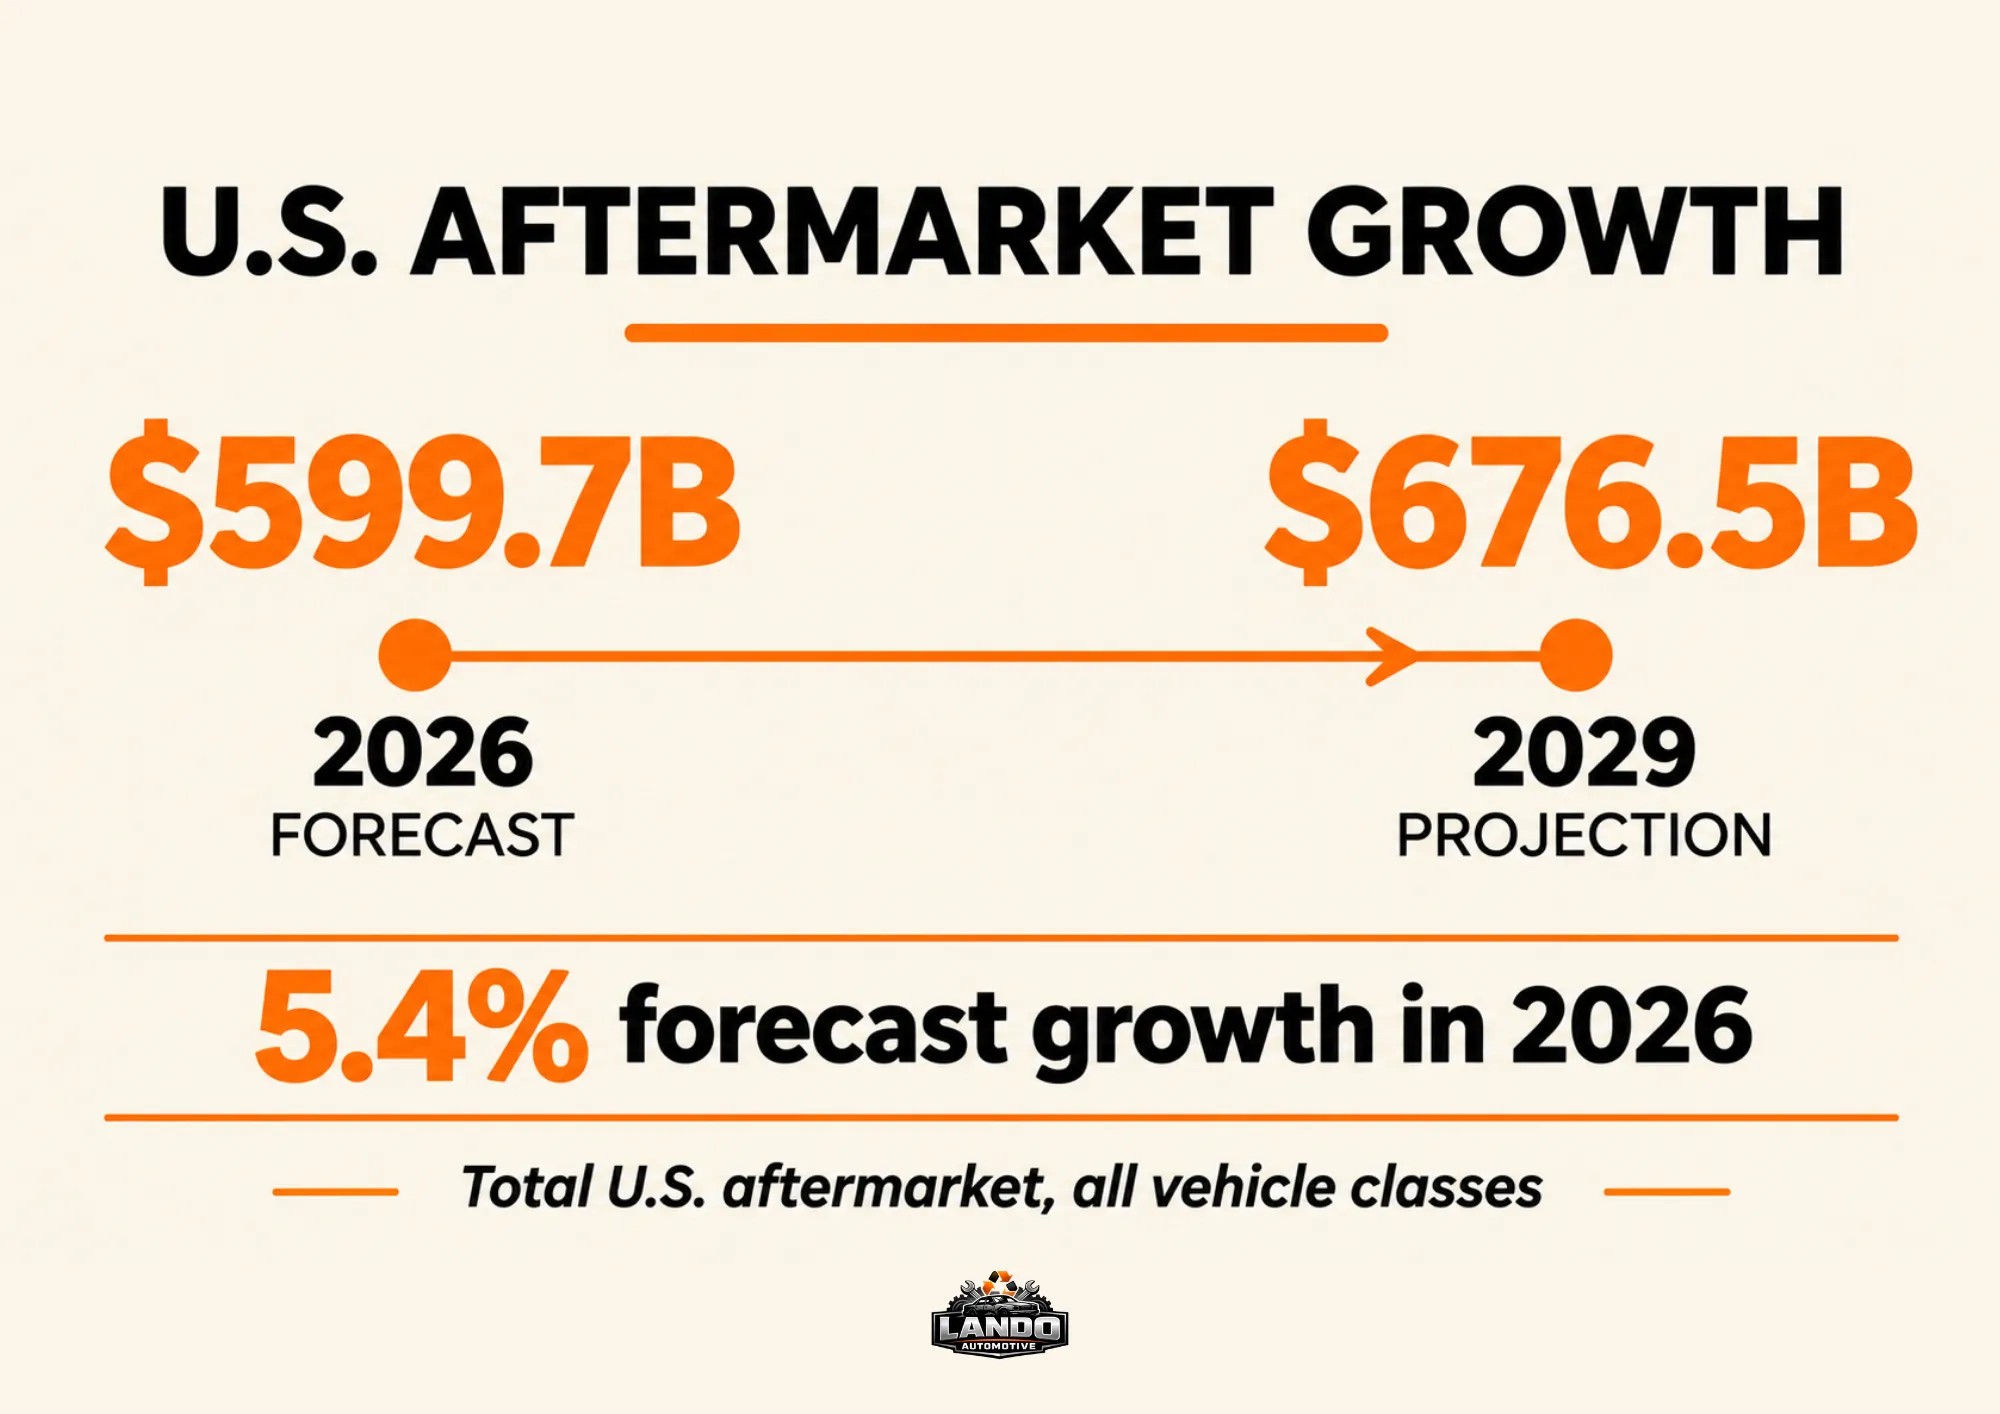
The total U.S. automotive aftermarket grew 3.9% in 2025. Sales are forecast to increase another 5.4% in 2026, reaching $599.7 billion, before rising to $676.5 billion by 2029.
These estimates include light-, medium-, and heavy-duty vehicles. Growth is supported by an expanding vehicle fleet, higher vehicle prices, and continued demand for maintenance and repairs.
U.S. light-duty automotive aftermarket statistics
The 2026 Joint Channel Forecast projects 5.2% growth in the light-duty aftermarket, with sales expected to exceed $500 billion by 2029.
This segment covers non-warranty replacement parts, fluids, and service labor for passenger cars and light trucks. It excludes medium- and heavy-duty vehicles, making it narrower than the total U.S. market.
Aftermarket auto parts sales statistics
Retail sales offer another way to track aftermarket spending. The U.S. Census Bureau’s retail sales data records sales at automotive parts, accessories, and tire stores, including approximately $12.3 billion in September 2026.
However, these figures exclude much of the repair and maintenance activity included in broader aftermarket estimates. They should be treated as retail sales statistics, not total industry revenue.
Vehicle age and the size of the vehicle fleet
The average age of U.S. light-duty vehicles reached 12.9 years, according to the 2027 Auto Care Factbook. The light-duty fleet is also projected to exceed 301 million vehicles by 2029.
Older vehicles generally require more replacement parts and maintenance as components wear out. However, average vehicle age doesn’t indicate how long individual car brands typically last. It measures the age of vehicles currently operating on U.S. roads.
Where Does Aftermarket Demand Come From?
Replacement parts and maintenance categories
Tires are the largest clearly defined category. Modern Tire Dealer sized the U.S. replacement tire market for cars and trucks at $57.7 billion in 2024, with passenger cars at about $36.6 billion. Brakes, batteries, and filters drive steady demand because they wear out on predictable schedules. We skip segment shares for those categories because current, clearly dated public figures are scarce. Trade reports behind paywalls, including the Factbook, hold them.
Retail, wholesale, repair shops, and online sales
Parts move through manufacturers, distributors, retailers, and repair shops. AAPEX data counts more than 6,700 U.S. parts manufacturers and 283,700 retailers. Independent repair shops account for approximately 80% of U.S. post-warranty repair capacity. Meanwhile, U.S. online automotive aftermarket parts sales were projected to reach $44.6 billion in 2025, including sales through third-party marketplaces.
Labor data shows where hiring goes. Employment at auto parts, accessories, and tire stores reached 616,100 in October 2026, up 17,600 year over year, according to preliminary Bureau of Labor Statistics data. Motor vehicle parts manufacturing employment fell by 7,800 jobs between September 2025 and September 2026.
DIY and do-it-for-me purchasing
Lang Marketing found do-it-for-me (DIFM) service held 77% of light-vehicle aftermarket volume in 2021, down from 80% in 2015. DIY rose from 20% to 23%. This matters for reporting, as a DIY purchase appears as a retail parts sale, while a DIFM job appears as parts plus labor, often bought by the shop at wholesale. The same brake job lands in different statistics depending on who does it.
What Is Driving Automotive Aftermarket Growth in 2026?
- An older fleet – Vehicles aged 6 to 14 are a key aftermarket segment, while high new-car prices encourage longer ownership
- Mileage – Americans drove approximately 3.3 trillion miles in 2024, increasing wear on vehicle components
- Repair costs – Rising maintenance expenses can lead owners to postpone repairs or reconsider when to get rid of an older car
- Digital purchasing – U.S. online aftermarket parts sales were estimated at $44.6 billion in 2025
- Vehicle technology – Advanced safety systems increase repair complexity and ADAS calibration requirements
Electric vehicles belong in this list as a changing mix, not a verdict. Battery electric vehicles average just 3.7 years old, so most still sit in warranty. As they age out, they’ll need different skills and equipment, while hybrids (6.4 years for conventional, 4.9 for plug-in) widen the mix further. Headwinds remain, including trade uncertainty, supply chain disruption, and geopolitical pressure.
How Recycling and Reused Parts Fit Into the Aftermarket
The automotive aftermarket includes used and remanufactured components supplied through the vehicle recycling market. Salvage yards recover usable parts, while remanufacturers rebuild components for reuse. Because these activities overlap with aftermarket sales, adding recycling revenue to aftermarket totals can lead to double-counting.
Vehicle recycling also involves recovering metals and other materials, making it broader than the resale of used parts. The share of a car that can be recycled measures material recovery rather than industry revenue. Research from Worcester Polytechnic Institute also found that reusing automotive parts can reduce greenhouse gas emissions compared with manufacturing new replacements.
Why Automotive Aftermarket Statistics Differ by Source
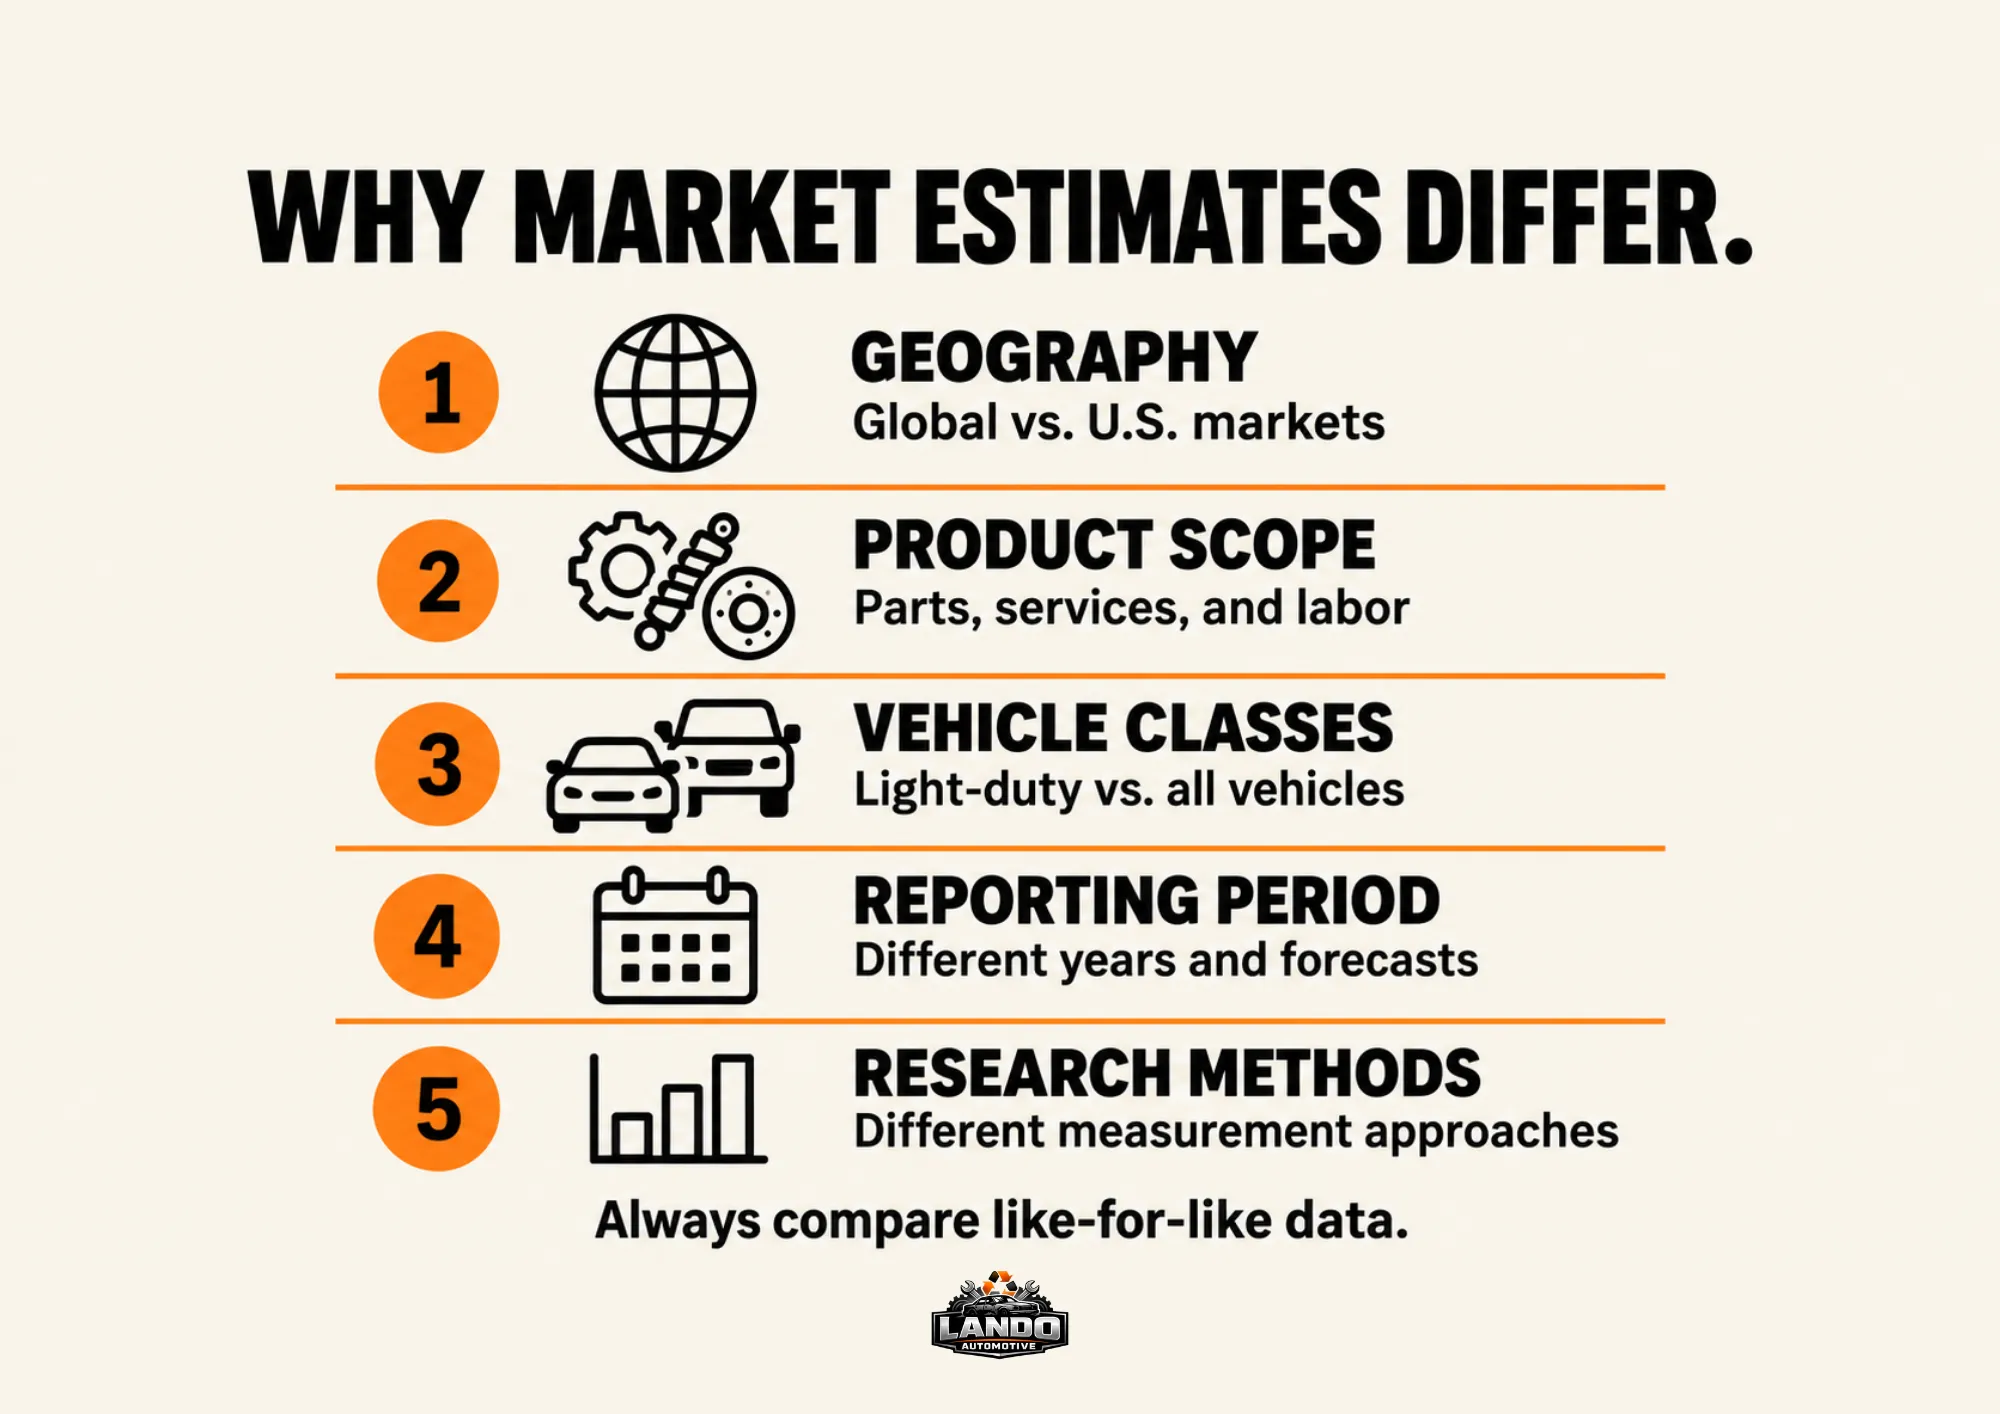
Automotive aftermarket statistics vary because reports measure different markets, products, and services. Before comparing figures, it’s important to check their geographic coverage, included activities, and reporting periods.
Global vs. U.S. market
Global estimates cover automotive aftermarket activity across multiple countries, while U.S. figures focus on the domestic market. Differences in geographic coverage make direct comparisons unreliable.
Parts sales vs. total aftermarket
Census retail data covers automotive parts, accessories, and tire retailers. Broader estimates, such as the $599.7 billion U.S. forecast for 2026, also include repair services, labor, and additional vehicle categories.
Historical sales vs. forecasts
Market forecasts represent projected sales rather than confirmed results. For example, the $435 billion U.S. light-duty estimate for 2025 was a forecast. Actual sales may differ, so figures should be identified by reporting year and data type.
Conclusion
Ultimately, automotive aftermarket industry statistics only help when you know what each number measures. A global estimate, a U.S. total, and a parts-store figure can all be accurate and still describe different things. Once you check the geography, year, and scope, the confusion fades.
The bigger picture is encouraging. Vehicles keep getting older, and the U.S. automotive aftermarket continues to grow, even as growth moderates. Whether you’re sizing a market or building a report, cite the exact measure behind every figure. That way, your numbers remain reliable and easy to verify.