
Every year, millions of cars quietly reach the end of the road. Most don’t end up rusting in a field somewhere. They’re stripped, shredded, and reborn as steel beams, engine parts, or brand-new bumpers. That invisible afterlife is what makes up the vehicle recycling market, and it’s bigger and stranger than most people realize.
Published estimates for the vehicle recycling market vary significantly depending on how each research firm defines the industry. Some focus mainly on recycled materials and vehicle components, while others include broader aftermarket and automotive recycling activity. This guide compares those estimates, explains why they differ, and looks at the car recycling statistics that provide a clearer picture of the industry’s current scale and direction.
Vehicle Recycling Market at a Glance
| Market Metric | Current Snapshot |
| Global Market Size | About $88.8–$119 billion in 2025, depending on the report |
| Forecast Growth | Major forecasts range from 6.1% to 13.56% CAGR |
| Leading Vehicle Category | Passenger cars, with about 68–76% market share |
| Leading Recovered Material | Iron and steel remain the dominant recovered material category |
| Largest Regional Market | North America or Europe, depending on the research methodology |
| Fastest-Growing Region | Asia-Pacific |
| Fast-Growing Segments | EV battery recycling and commercial vehicle recycling |
How Large Is the Vehicle Recycling Market?
Published estimates for the end of life vehicle recycling market vary by methodology, scope, and base year. The figures below compare the latest available estimates from major research providers.
Vehicle recycling market size estimates compared
| Research Provider | Base-Year Value | Forecast Value | Forecast Year | CAGR | Apparent Scope |
| MarketsAndMarkets | $81.2B (2022) | $143.6B | 2027 | 12.1% | Materials + ICE/EV components |
| Fortune Business Insights | $118.91B (2025) | $373.47B | 2034 | 13.56% | Type, propulsion, material |
| Mordor Intelligence | $119.01B (2025) | $243.06B | 2031 | 12.99% | Type, material, application, process |
| Market Glass, Inc. | $90.3B (2024) | $191.4B | 2030 | 13.3% | Material, vehicle type, application |
| IMARC Group | $105.5B (2025) | $329.9B | 2034 | 12.83% | Type, material, application |
| Lucintel | — | $155.9B | 2030 | 12.5% | Material, vehicle type, region |
| Business Research Insights | $281.6B (2026) | $332.2B | 2035 | 18% | Metal, polymer, other |
Most of the estimates cluster within a broadly similar range, with base-year market values around $80–120 billion and forecast CAGRs generally near 12–13.6%. That makes them more directly comparable than the much larger “automotive recycling” estimate.
The outlier should be treated cautiously. Its broader market definition and inconsistent published growth figures make it a poor standalone benchmark for the vehicle recycling market, especially when compared with reports using narrower definitions.
Why vehicle recycling market estimates differ
Vehicle recycling estimates vary mainly because research firms define the market differently. Some focus more on reused parts and aftermarket sales, while others emphasize recovered steel, aluminum, copper, or EV battery recycling. IMARC, for example, puts the aftermarket at 95.1% in 2025, while Fortune Business Insights assigns commercial vehicles a 32% share.
Regional scope and forecasting methods also change the totals. Fortune Business Insights gives Europe a 34% revenue share in 2025, while Mordor Intelligence puts North America at 44.27%. Different base years, market definitions, and modeling methods can therefore produce very different results, so no single estimate fits every version of the market.
Key Car Recycling Statistics
| Statistic | Key Figure |
| Vehicles Recycled Annually | Over 4 million vehicles are processed each year in the U.S. and Canada. For broader context, see the latest vehicle scrappage figures. |
| Global Volume | About 40 million vehicles reach end of life globally each year, with roughly 27 million recycled. |
| Recoverable Vehicle Weight | About 86% by weight is recycled, reused, or recovered for energy. |
| Steel and Iron | Steel remains one of the largest recovered vehicle materials. Exact shares vary by vehicle type and dataset. |
| Battery Recycling | Lead-acid batteries have a 99% U.S. recycling rate. Li-ion battery recycling is also growing quickly. |
| Tire Recycling | Scrap tires commonly go to tire-derived fuel, civil engineering, and ground rubber. |
| Industry Scale | More than 140,000 people work in U.S. automotive recycling across 9,000+ locations, generating about $32 billion in annual sales. |
| Vehicle Age | Older fleets in mature markets are increasing the number of vehicles approaching end of life. |
| Recycled Content | About 25% of the steel in new cars is reported to come from recycled steel. |
What Is the Vehicle Recycling Market?
The vehicle recycling market covers the full process of moving end-of-life vehicles from acquisition to parts recovery and material recycling. Key activities include:
- Vehicle acquisition and salvage auctions – Sourcing junked, damaged, or written-off vehicles
- Dismantling and parts resale – Removing reusable engines, transmissions, electronics, body parts, and other components
- Fluid and hazardous-material removal – Draining oils, coolant, fuel, and handling batteries before processing
- Crushing, shredding, and separation – Reducing vehicle shells and sorting ferrous metals, nonferrous metals, and residue
- Scrap-metal processing – Sending recovered metals to mills and smelters
- Specialized recycling – Processing batteries, tires, glass, plastics, and other materials through dedicated streams
Together, these activities make vehicle recycling a network of salvage, dismantling, parts recovery, and materials processing rather than a single business type.
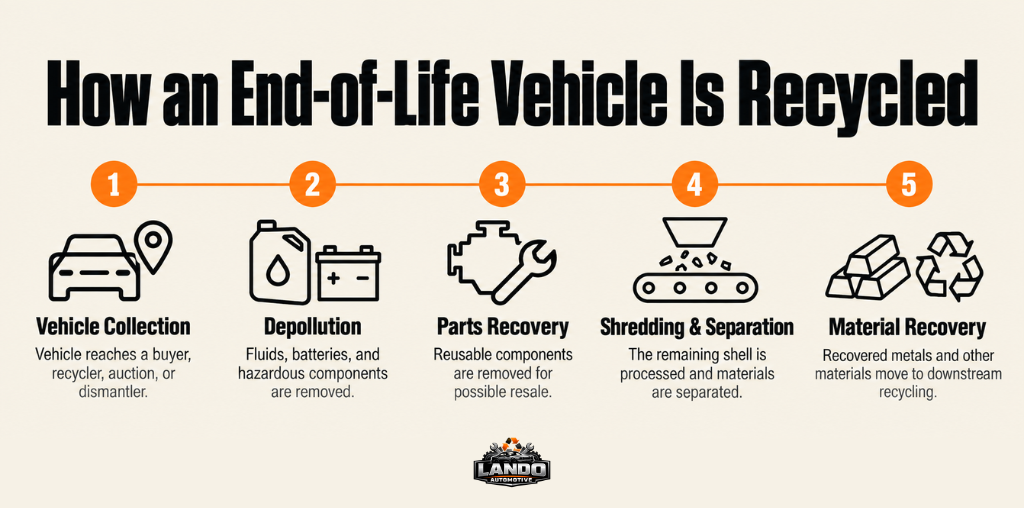
How an End-of-Life Vehicle Is Recycled
Vehicle collection and ownership transfer
The recycling chain starts when a vehicle changes hands for the last time. That can happen through working with a professional junk car buyer, an insurance company declaring a vehicle a total loss after an accident, a salvage auction, or a dealership trade-in that isn’t roadworthy enough to resell.
Depollution and dismantling
Before anything gets crushed, licensed facilities remove fluids (oil, coolant, brake fluid, fuel), disconnect and remove the battery, and extract hazardous materials like airbag inflators. Technicians then pull parts with resale value, like engines, transmissions, body panels, starters, and alternators, for cleaning, testing, and resale.
Crushing, shredding, and material separation
After reusable parts and hazardous materials are removed, the remaining vehicle shell is sent to a shredder. The shredder breaks it into smaller fragments for material recovery.
Magnets remove steel and iron, while eddy-current separators separate nonferrous metals such as aluminum and copper. The remaining automotive shredder residue contains materials like plastics, foam, glass, and rubber. Depending on the facility, it may be processed further or sent to landfill.
Reuse and downstream material processing
Recovered metal goes to steel mills and aluminum smelters, where it’s remelted into new automotive-grade material, often with a significantly lower carbon and energy footprint than virgin production. Recovered parts flow into repair shops and the broader aftermarket, while recycled plastics and rubber find their way into everything from carpet padding to new bumper components.
Vehicle Recycling Market by Material
Steel and iron
Steel and iron typically make up the largest share of a vehicle’s recoverable weight, often cited between 40% and 60% depending on how a report bundles the two categories. The recovery infrastructure for ferrous metal is the most mature part of the industry, with well-established shredding, magnetic sorting, and mill-remelt pathways already in place worldwide.
Aluminum and copper
Aluminum and copper carry a much higher per-pound value than steel and are becoming more important as automakers lean into lightweighting to improve fuel economy and EV range. Several major manufacturers now run closed-loop aluminum recycling programs, feeding production scrap directly back into new body panels, cutting both cost and energy use compared with primary smelting.
Automotive batteries
Conventional lead-acid batteries have a 99% recycling rate in the U.S., supported by a well-established collection and recycling network. Lithium-ion EV batteries are a different story, as recovery requires specialized hydrometallurgical or pyrometallurgical processing to recapture lithium, cobalt, and nickel, and the infrastructure is still scaling to meet future demand.
Tires and rubber
Scrap tires move into tire-derived fuel, civil engineering applications (like rubberized asphalt), and ground rubber products such as playground surfacing or flooring. Full material recovery from tires remains more limited than metal recovery, since vulcanized rubber is difficult to break back down into reusable raw compound.
Plastics, glass, and composite materials
This is the hardest category to recycle economically. Modern vehicles use dozens of distinct plastic compounds, often bonded with adhesives that resist clean separation. Laminated windshield glass requires different processing than standard bottle glass. Composite materials like carbon-fiber-reinforced polymer, increasingly used to reduce vehicle weight, are currently among the most difficult automotive materials to recover at scale.
Vehicle Recycling Market by Vehicle Type
Passenger vehicles
Passenger cars consistently represent the largest share of recycling volume, cited anywhere from roughly two-thirds to over 80% of the market depending on the report. It’s simply because there are so many more of them on the road, and their average service life is shorter than that of most commercial vehicles.
Commercial vehicles
Trucks, buses, and heavy-duty fleet vehicles make up a smaller share of overall volume but tend to yield disproportionately higher recovered material value per unit, given their larger structural mass and higher metal content.
Electric and hybrid vehicles
Electrified vehicles introduce a genuinely different recycling workflow – one built around high-voltage battery handling, expanded wiring and electronics recovery, and specialized worker safety training that traditional ICE-vehicle dismantling never required. This segment is small today relative to total volume, but it’s the fastest-growing part of nearly every published forecast.
What Is Driving Vehicle Recycling Market Growth?
Vehicle recycling market growth is being driven by a larger supply of end-of-life vehicles, stronger demand for recycled metals and reusable parts, and tighter recovery requirements in many markets. Older vehicle fleets also increase the number of cars reaching dismantlers, while higher raw-material costs can make recovered steel, aluminum, copper, and components more valuable.
EV growth is adding another layer. More electric vehicles eventually means more lithium-ion batteries entering recycling streams, creating demand for specialized recovery capacity. At the same time, better sorting and processing technology is helping recyclers recover more value from metals, plastics, batteries, and other vehicle materials.
How Electric Vehicles Are Changing Car Recycling
EVs add new challenges to vehicle recycling. High-voltage battery packs must be safely discharged and removed before dismantling, requiring dedicated work areas, voltage monitoring, and trained technicians.
After removal, batteries may be reused, repurposed for stationary energy storage, or recycled to recover lithium, nickel, cobalt, copper, and aluminum. Some analysis suggests second-life storage could compete with material recycling for aging battery supply.
EVs also contain more wiring, electronics, and sensors than comparable ICE vehicles, making dismantling more complex. At the same time, today’s EV sales will not reach recycling facilities for years, so much of the battery-recycling capacity being built now is aimed at future demand.
Challenges Facing the Vehicle Recycling Industry
Vehicle recyclers face several financial, technical, and regulatory pressures:
- Volatile scrap-metal prices can quickly change the value recovered from each vehicle.
- High equipment costs make shredding, sorting, and material recovery capital-intensive.
- Mixed materials such as plastics, composites, adhesives, and electronics make dismantling more complex.
- Automotive shredder residue can be costly to process or dispose of.
- Hazardous fluids and EV batteries require careful handling, safety procedures, and compliance.
- Uneven regulations and informal operators can create different compliance costs and competitive conditions across markets.
A steady supply of end-of-life vehicles also matters. When fewer vehicles reach recyclers, facilities may struggle to keep equipment and labor fully utilized.
Vehicle Recycling Market in the United States
TThe US has a large, established vehicle recycling network made up of dismantlers, parts resellers, scrap processors, auctions, and shredding facilities. Different operators handle different stages, which is why the role of a scrap yard or junkyard can vary depending on whether the focus is reusable parts, whole vehicles, or processed metal.
State rules for title transfer, salvage vehicles, and disposal also affect how vehicles move through the system. In the Midwest, dense vehicle supply and access to steel-processing infrastructure have made the region an important link between dismantling, shredding, and downstream metal recovery.
How Vehicle Owners Participate in the Recycling Market
Vehicle owners usually enter the recycling process by selling or transferring an end-of-life vehicle to a licensed buyer, dismantler, or recycling facility. The vehicle is evaluated, ownership is verified, and it is either picked up or delivered to the site.
From there, reusable parts are removed first. Fluids, batteries, and other hazardous materials are handled before the remaining shell is crushed, shredded, and separated for material recovery. Each vehicle moves through this chain differently depending on its condition, value, and local requirements.
Vehicle Recycling Market Outlook
More advanced material recovery
Automated dismantling and AI-assisted sorting are expected to expand as recyclers look for faster, more precise material separation. Vehicle design may also shift toward easier disassembly at end of life.
EV battery recycling growth
North America, Europe, and Asia are adding more battery-processing capacity as electric vehicles create new recycling demand. Battery recovery will become a larger part of the wider vehicle recycling market.
More recycled content in new vehicles
Automakers are placing more emphasis on recycled materials and traceable supply chains. This is increasing demand for certified recovered metals and other materials that can be reused in manufacturing.
Digital and industry consolidation
Online salvage auctions and parts marketplaces are expanding buyer reach and improving price discovery. At the same time, larger recyclers continue to acquire regional and independent operators, increasing consolidation across the industry.
Frequently Asked Questions
What is driving growth in the vehicle recycling market?
Growth is being supported by demand for recycled materials, end-of-life vehicle regulations, EV battery recycling, reusable-parts demand, and improvements in material recovery.
Which region leads the vehicle recycling market?
North America is the largest region in several current reports, although some research providers place Europe first because they use different market definitions and methodologies.
Which part of vehicle recycling is growing fastest?
EV battery recycling is among the fastest-growing areas, driven by increasing electric-vehicle adoption and the need to recover materials such as lithium, nickel, cobalt, copper, and aluminum.