
Most of us have stood in a driveway wondering how much life is left in our car. The odometer keeps climbing, the repair bills get a little bigger, and the question gets harder to ignore. Average car lifespan by brand is what many drivers search for, hoping for a clean number of years. The truth is a bit more interesting than that.
No single number can tell you how long your car will last. This guide covers the best data available, which ranks 33 brands by their odds of reaching 250,000 miles. You’ll learn which badges beat the average and why two cars from the same brand can age so differently. Below, we’ll break down what the rankings really show.
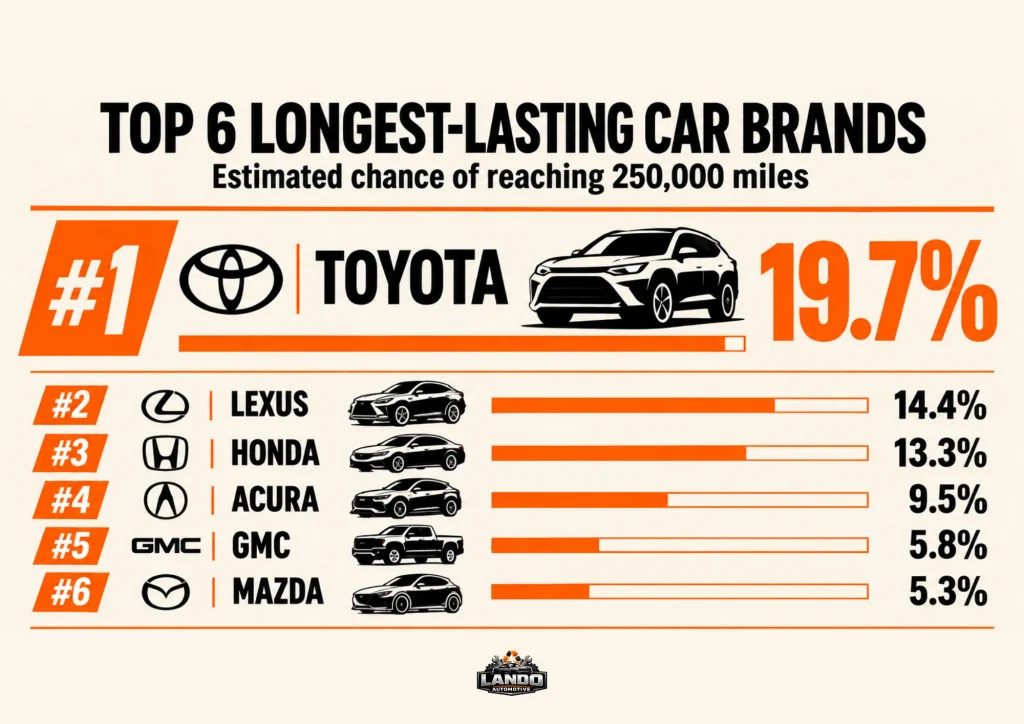
Average Car Lifespan by Brand – Comparison Table
The following table ranks 33 car brands by their estimated chances of reaching high mileage. It also shows how each brand compares with the industry average, making it easier to identify which brands perform better.
| Rank | Brand | Chance of 250,000+ Miles | Compared to Average |
| 1 | Toyota | 19.7% | 3.7x |
| 2 | Lexus | 14.4% | 2.7x |
| 3 | Honda | 13.3% | 2.5x |
| 4 | Acura | 9.5% | 1.8x |
| 5 | GMC | 5.8% | 1.1x |
| 6 | Mazda | 5.3% | 1.0x |
| 7 | Lincoln | 4.7% | 0.9x |
| 8 | Ram | 4.2% | 0.8x |
| 9 | Ford | 4.1% | 0.8x |
| 10 | Cadillac | 3.9% | 0.7x |
| 11 | Chevrolet | 3.6% | 0.7x |
| 12 | Nissan | 3.4% | 0.6x |
| 13 | Tesla | 3.3% | 0.6x |
| 14 | Subaru | 2.8% | 0.5x |
| 15 | Mercedes-Benz | 2.6% | 0.5x |
| 16 | Volvo | 2.6% | 0.5x |
| 17 | INFINITI | 2.5% | 0.5x |
| 18 | Dodge | 1.7% | 0.3x |
| 19 | Volkswagen | 1.5% | 0.3x |
| 20 | Jeep | 1.2% | 0.2x |
| 21 | Kia | 0.8% | 0.2x |
| 22 | Mitsubishi | 0.8% | 0.2x |
| 23 | Hyundai | 0.8% | 0.2x |
| 24 | Chrysler | 0.7% | 0.1x |
| 25 | BMW | 0.5% | 0.1x |
| 26 | Audi | 0.5% | 0.1x |
| 27 | Land Rover | 0.4% | 0.1x |
| 28 | Buick | 0.4% | 0.1x |
| 29 | Porsche | 0.3% | 0.1x |
| 30 | FIAT | 0.2% | 0x |
| 31 | Jaguar | 0.0% | 0x |
| 32 | MINI | 0.0% | 0x |
| 33 | Maserati | 0.0% | 0x |
Source: 2026 iSeeCars Longest Lasting Car Brands Study. Figures are estimated probabilities, not guarantees. A reported 0.0% doesn’t mean reaching 250,000 miles is impossible.
How “Car Lifespan” Is Measured
Car lifespan can mean different things depending on how it is measured. Some figures show how likely a vehicle is to reach high mileage, while others focus on its age, reliability, or how long owners keep it.
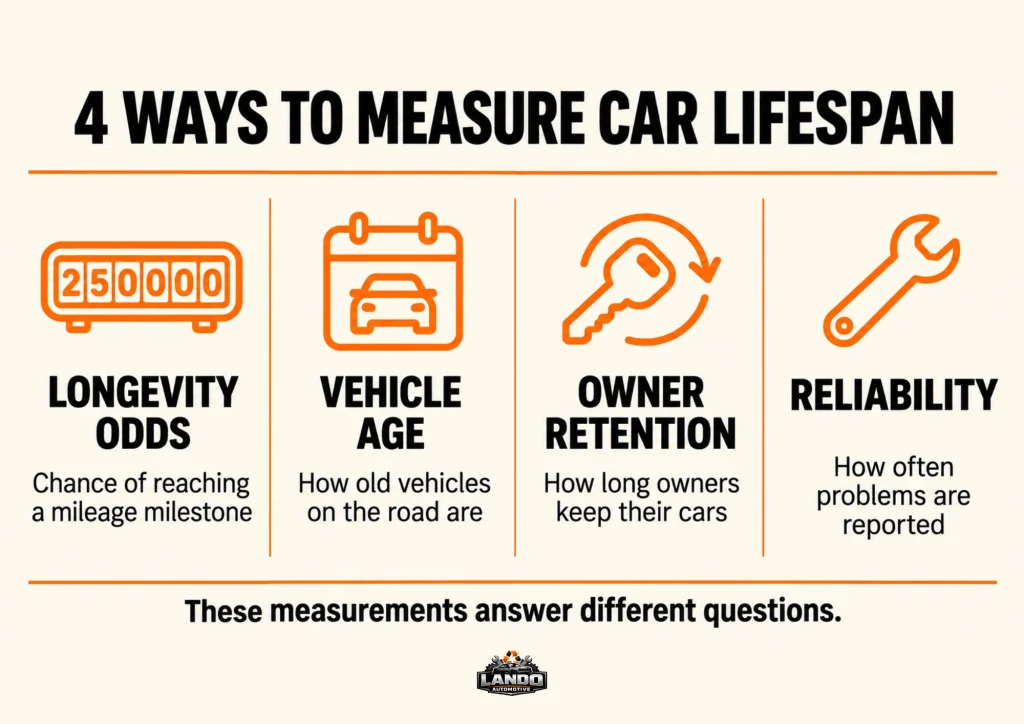
Four ways to measure car lifespan
Understanding these differences helps you compare brands without confusing vehicle age with durability. The following four metrics each offer a different perspective on how long cars last.
- Longevity odds
Longevity odds estimate how likely a vehicle is to reach a specific mileage threshold. For example, the average probability of a vehicle reaching 250,000 miles was 5.4% in 2026, although the chances vary significantly between brands and models.
- Average age of cars by brand
The average age of vehicles shows how long cars have been on the road, rather than how long they will ultimately last. In 2026, the average U.S. light vehicle was 12.94 years old. Passenger cars averaged 15 years, while light trucks averaged 11.9 years. However, these figures compare vehicle types rather than individual brands.
- Owner retention
Owner retention measures how long drivers keep their vehicles before selling or replacing them. In one analysis covering 10 brands, Volvo owners kept their vehicles the longest, averaging 9.0 years, while MINI owners averaged 4.9 years. These findings reflect a limited customer sample rather than nationwide ownership trends.
- Reliability scores
Reliability scores reflect how frequently vehicle owners report mechanical and other problems. Based on data from more than 140,000 vehicles from the 2016-2021 model years, Lexus ranked first with a score of 77, followed by Toyota at 73 in a December 2025 analysis covering 26 brands.
How the iSeeCars study measures longevity
To understand which car brands are most likely to last, the 2026 iSeeCars Longest Lasting Car Brands Study examined data from more than 395 million vehicles.
Researchers looked at average mileage by vehicle age and used a statistical model to estimate the chances of reaching different mileage milestones. They then combined the results across each brand’s models and generations, accounting for how common each was on the road.
Study limitations
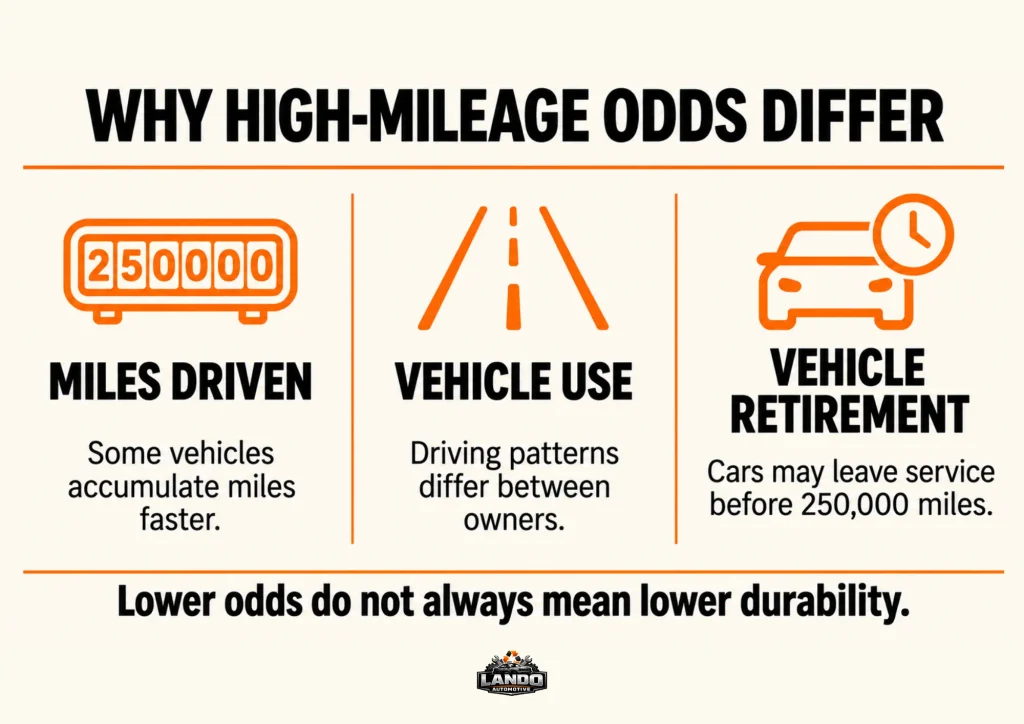
While the rankings offer useful insights, they have some limitations. The study excludes heavy-duty vehicles and models with insufficient data. Its estimates also reflect how much owners drive, not just how durable their vehicles are.
For example, Porsche’s low probability of reaching 250,000 miles partly reflects lower mileage among its owners rather than necessarily poor durability. This means the rankings can help compare high-mileage potential, but they cannot predict exactly how long an individual car will last.
Which Brands Rank Highest?
Japanese automakers dominate the rankings, taking all four top spots. Toyota leads with a 19.7% chance of reaching 250,000 miles, more than three times the industry average. Lexus follows at 14.4%, Honda at 13.3%, and Acura at 9.5%. GMC ranks fifth at 5.8%, making it the highest-ranked non-Japanese brand, followed by Mazda at 5.3%.
The rankings also reveal differences between luxury and non-luxury brands:
- Non-luxury brands (5.8% average) – Toyota (19.7%) and Honda (13.3%) lead. GMC (5.8%) matches the average, followed by Mazda (5.3%), Ram (4.2%), Ford (4.1%), and Chevrolet (3.6%).
- Luxury brands (3.4% average) – Lexus (14.4%) and Acura (9.5%) lead. Lincoln (4.7%) and Cadillac (3.9%) also exceed the average. Tesla (3.3%) falls slightly below, while several other brands rank under 1%.
However, these figures don’t tell the whole story. Karl Brauer, Executive Analyst at iSeeCars, explains that luxury vehicles are often driven less than mainstream models. For example, Porsche’s low ranking may reflect lower mileage rather than poor durability. The study estimates how likely vehicles are to reach 250,000 miles, but the results also depend on how much owners drive.
Why Cars of the Same Brand Can Have Different Lifespans
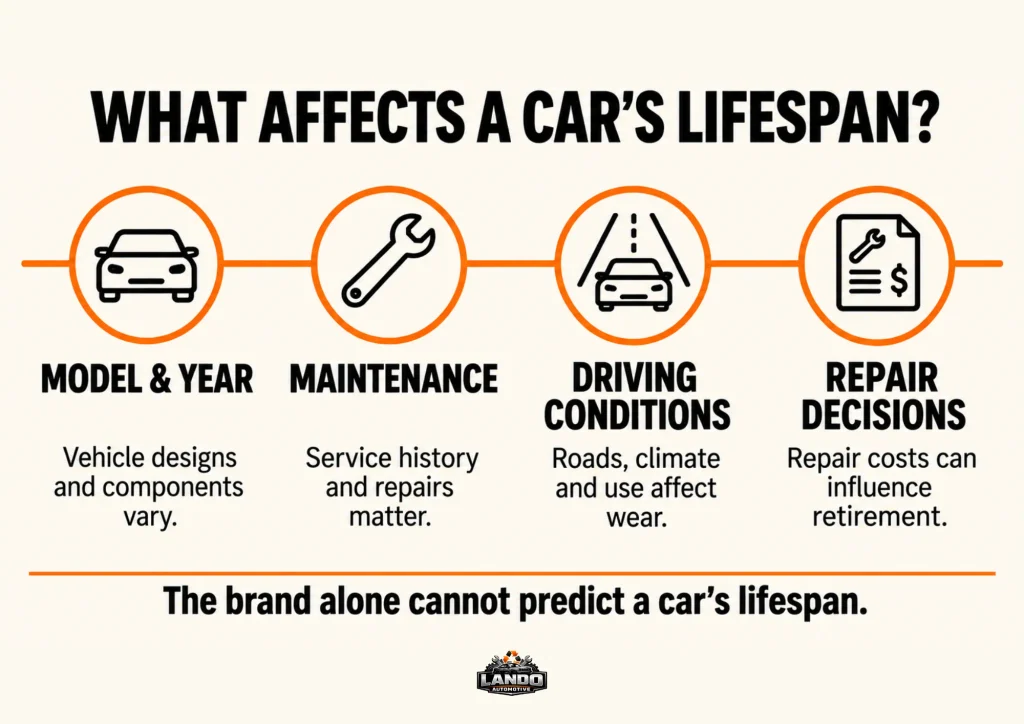
Model and model-year differences
Not every vehicle from the same brand lasts equally long. Some models have a much better chance of reaching high mileage than others. For example, the Toyota Sequoia has a 42.3% estimated chance of reaching 250,000 miles, compared with Toyota’s overall average of 19.7%. The Lexus LS reaches 38.8%, while the Mercedes-Benz G-Class stands at 17.3%, far above Mercedes-Benz’s brand average of 2.6%.
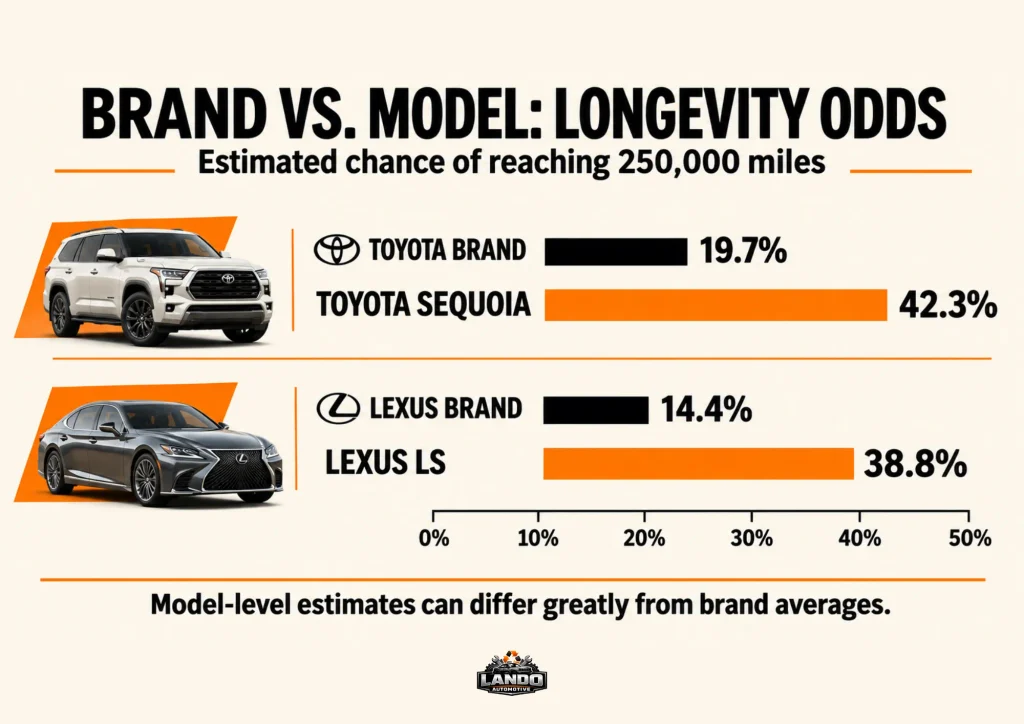
Model years also matter. Changes in engines, transmissions, and other components can affect reliability, even within the same model. That’s why checking the specific model and year gives you a better picture than relying on brand rankings alone.
Maintenance and repair history
Following the manufacturer’s service schedule, including oil and filter changes, can help extend a vehicle’s life. Maintenance records show how consistently a car has been serviced, but they cannot guarantee its remaining lifespan. A vehicle’s current condition, mileage, and repair history also matter.
Driving conditions, mileage and climate
Short city trips, frequent towing, salted winter roads, and extreme heat can affect vehicle wear. Mileage matters, but age, maintenance, and overall condition are also important. A low-mileage car isn’t automatically in better condition than a well-maintained, high-mileage vehicle.
Owner decisions and repair costs
A car’s lifespan also depends on how much its owner is willing to spend on repairs. Some vehicles are taken off the road because fixing them costs more than they’re worth, even when they’re still drivable. Others remain in use for years because their owners continue investing in maintenance and repairs.
While vehicle scrappage statistics show how many cars are retired, they don’t explain the reasons behind each decision. This means differences in car life expectancy by brand may reflect ownership decisions, not just vehicle durability.
What to Do With a Car Near the End of Its Life
Compare the cost of upcoming repairs with the cost of replacing your vehicle. An expensive repair doesn’t automatically make replacement the better option, even if the bill exceeds the car’s market value. Consider the vehicle’s overall condition, future repair needs, safety, and how much longer you expect to use it.
If the car is otherwise sound, a single repair can be worth it. However, deciding when to get rid of a car depends on its overall condition, safety, and the likelihood of future repairs. Even older or non-running vehicles can retain value, whether they’re sold as-is or recycled for usable parts and scrap metal.
For vehicles with extensive damage or costly mechanical problems, looking a cash for junk cars service may be a more practical option than investing in further repairs. If you’re considering this route, you can request a no-pressure quote from Lando Automotive to find out what your car could be worth.
Conclusion
Ultimately, average car lifespan by brand is a useful starting point, not a final verdict. Toyota, Lexus, Honda, and Acura clearly lead the odds of reaching 250,000 miles. Yet model, maintenance, and driving habits shape each car’s story just as much as the badge.
Whether you’re buying used or deciding how long to keep your current car, look past the logo. Check the specific model, ask for service records, and weigh repair costs honestly. If your car has reached the end of the road, it may still hold value worth exploring.